Errors as metrics in NestJS
In the First part I described how errors in NestJS could be made more informative and unified. In this story, I will show you how to convert your errors not only to log lines by also to Prometheus metrics.
If you haven’t read the first part of the story, I highly encourage you to do so. It will provide you the idea of properly structured exceptions.

Table of Contents
- Step 1. Add prometheus to our project
- Step 2. Create error counter
- Step 3. Adding error counter to ExceptionFilter
- Step 4. Using error counter
- Step 5. Generating some error
- Step 6. Setting up prometheus
- Step 7. Generating metrics
- Step 8. Visualising metrics
- Summary
Step 1. Add prometheus to our project
Let’s install nestjs-prometheus:
npm install --save \
  @willsoto/nestjs-prometheus \
  prom-client
Next we’ll need to import PrometheusModule in app.module.ts:
import { Module } from '@nestjs/common';
import { AppController } from './app.controller';
import { PrometheusModule } from '@willsoto/nestjs-prometheus';

@Module({
  imports: [PrometheusModule.register()],
  controllers: [AppController],
})
export class AppModule {}
Check exposed metrics:
$ http http://localhost:3000/metricsHTTP/1.1 200 OK# HELP process_cpu_user_seconds_total Total user CPU time spent in seconds.
# TYPE process_cpu_user_seconds_total counter
process_cpu_user_seconds_total 0.28837199999999996

# ...
# ...
Metrics you see here are default Node.js metrics exposed by nestjs-prometheus. Checkout docs on how to disable them.
Step 2. Create error counter
In order to export occurred exceptions we need to create a separate counter. Counters can have labels for categorising collected metrics. What properties all exceptions have in common?
- Error domain (e.g.
users,orders, etc.) - Response status code
- Optionally, error code (not part of this story)
Do not use labels to store dimensions with high cardinality, e.g. error messages. This will dramatically increase the amount of data stored.
So, at first let’s create a counter for our errors. In app.module.ts add new provider:
import { Module } from '@nestjs/common';
import { AppController } from './app.controller';
import {
  makeCounterProvider,
  PrometheusModule,
} from '@willsoto/nestjs-prometheus';

@Module({
  imports: [PrometheusModule.register()],
  providers: [
    makeCounterProvider({
      name: 'nestjs_errors',
      help: 'nestjs_errors', // you can do better, I know :D
      // label names we would like to track
      labelNames: ['domain', 'status'],
    }),
  ],
  controllers: [AppController],
})
export class AppModule {}
Step 3. Adding error counter to ExceptionFilter
In order to use our counter we need to inject it to the place where all our exceptions are being handled. That’s exception.filter.ts:
import {
  ArgumentsHost,
  Catch,
  ExceptionFilter,
  Logger,
} from '@nestjs/common';
import { InjectMetric } from '@willsoto/nestjs-prometheus';
import { Counter } from 'prom-client';

// ...

@Catch(Error)
export class CustomExceptionFilter implements ExceptionFilter {
  private readonly logger = new Logger(CustomExceptionFilter.name);

  constructor(
    @InjectMetric('nestjs_errors') private readonly counter: Counter<string>,
  ) {}

  catch(exception: Error, host: ArgumentsHost) {
    // ...
  }
}
Here’s where things are getting interesting. Previously, we initialised our CustomExceptionFilter manually in main.ts:
import { NestFactory } from '@nestjs/core';
import { AppModule } from './app.module';
import { CustomExceptionFilter } from './exception.filter';

async function bootstrap() {
  const app = await NestFactory.create(AppModule);
  // Manually initialize our ExceptionFilter
  app.useGlobalFilters(new CustomExceptionFilter());
  await app.listen(3000);
}

bootstrap();
But because now our CustomExceptionFilter needs to be a part of Dependency Injection, it has to be added as a global filter in app.module.ts:
import { Module } from '@nestjs/common';
import { AppController } from './app.controller';
import {
  makeCounterProvider,
  PrometheusModule,
} from '@willsoto/nestjs-prometheus';
import { APP_FILTER } from '@nestjs/core';
import { CustomExceptionFilter } from './exception.filter';

@Module({
  imports: [PrometheusModule.register()],
  providers: [
    makeCounterProvider({
      name: 'nestjs_errors',
      help: 'nestjs_errors',
      labelNames: ['domain', 'status'],
    }),
    {
      provide: APP_FILTER,
      useClass: CustomExceptionFilter,
    },
  ],
  controllers: [AppController],
})
export class AppModule {}
Step 4. Using error counter
As a result of the first part we had a unified error type as an outcome of all errors occurred in our application. So we can simply use its properties as label values and increase error counter in exception.filter.ts:
import {
  ArgumentsHost,
  Catch,
  ExceptionFilter,
  HttpException,
  HttpStatus,
  Injectable,
  Logger,
} from '@nestjs/common';
import { Request, Response } from 'express';
import { BusinessException, ErrorDomain } from './business.exception';
import { InjectMetric } from '@willsoto/nestjs-prometheus';
import { Counter } from 'prom-client';

// ...

@Catch(Error)
export class CustomExceptionFilter implements ExceptionFilter {
  private readonly logger = new Logger(CustomExceptionFilter.name);

  constructor(
    @InjectMetric('nestjs_errors') private readonly counter: Counter<string>,
  ) {}

  catch(exception: Error, host: ArgumentsHost) {
    let error: BusinessException;
    let status: HttpStatus;

    // some code omitted    this.counter.labels(
      error.domain,
      error.status.toString()
    ).inc();

    response.status(status).json(error.toApiError());
  }
}
Okay, so what we have now is that every time some error occurs our counter is increased and exposed as a metric. We’ll see the data in the next steps.
Step 5. Generating some error
In app.controller.ts let’s make our endpoint to throw random errors of all types on each request:
import { Controller, Get, HttpException, HttpStatus } from '@nestjs/common';
import { BusinessException, ErrorDomain } from './business.exception';

@Controller()
export class AppController {
  @Get()
  public getHello() {
    throw AppController.genError();
  }

  private static genError(): Error {
    const getRandom = <T>(...values: T[]): T =>
      values[Math.floor(Math.random() * values.length)];

    const domain = getRandom(
      ErrorDomain.Generic,
      ErrorDomain.Orders,
      ErrorDomain.Users,
    );
    const status = getRandom(
      HttpStatus.BAD_REQUEST,
      HttpStatus.NOT_FOUND,
      HttpStatus.CONFLICT,
      HttpStatus.FORBIDDEN,
      HttpStatus.UNAUTHORIZED,
      HttpStatus.BAD_GATEWAY,
      HttpStatus.GATEWAY_TIMEOUT,
    );

    switch (Math.floor(Math.random() * 3)) {
      case 0:
        return new HttpException('nestjs-exception', status);
      case 1:
        return new Error('unknown-error');
      case 2:
        return new BusinessException(
          domain,
          'business-exception',
          'business-exception',
          status,
        );
    }
  }
}
Step 6. Setting up prometheus
I will use docker-compose to spin up a Prometheus instance. Also I will start our service as a docker container in order to simplify connectivity between Prometheus and our service. I have a step-by-step guide on how to dockerise NestJS applications.
version: "3.9"

services:
  nestjs:
    build: . # Run our service as a docker container
    ports:
      - "3000:3000"
  prometheus:
    image: prom/prometheus:v2.36.2
    ports:
      - "9090:9090"
    volumes:
      - ./docker-compose/prometheus/prometheus.yml:/etc/prometheus/prometheus.yml
    # - prometheus-data:/prometheus # TODO
    command: --config.file=/etc/prometheus/prometheus.yml
Tell Prometheus to scrape our service for metrics, docker-compose/prometheus/prometheus.yml:
global:
  scrape_interval: 5s # Scrape every 5 seconds
  scrape_timeout: 1s

scrape_configs:
  - job_name: services
    metrics_path: /metrics
    static_configs:
      - targets:
          - 'nestjs:3000' # Name of our service in docker-compose
This file is later mounted to the Prometheus container.
Step 7. Generating metrics
Okay, we’ve done a great job now. Let run everything and see what we have in prometheus. In your project directory run:
$ docker-compose up # or docker compose up since Compose V2# You should see something like this
prometheus_1  | ts=2022-07-05T19:09:26.194Z caller=manager.go:937 level=info component="rule manager" msg="Starting rule manager..."
prometheus_1  | ts=2022-07-05T19:09:26.193Z caller=main.go:957 level=info msg="Server is ready to receive web requests."
nestjs_1      | [Nest] 1  - 07/05/2022, 7:09:26 PM     LOG [NestApplication] Nest application successfully started +3ms
Let’s open prometheus dashboard at http://localhost:9090/graph.
Query for our error metrics would simply be nestjs_errors, remember how we named our counter?
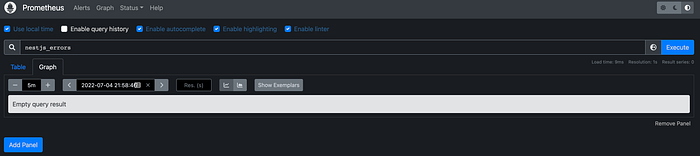
The reason we get an empty result is because there was no traffic since we launched our service. Let’s make some requests to our service:
# Every 0.2 seconds execute 'curl http://localhost:3000/'
$ while true; do curl http://localhost:3000/ ; sleep 0.2; done;# Output
{"id":"vchTNh0qO6Ucygm5","domain":"generic","message":"Internal error occurred","timestamp":"2022-07-05T19:15:17.211Z"}{"id":"uK4c0QcVTKDZg1cv","domain":"generic","message":"nestjs-exception","timestamp":"2022-07-05T19:15:17.443Z"}
...
Okay, we’ve generated some traffic (you can leave it running if you would like to continuously generate metrics). Rerun prometheus query:
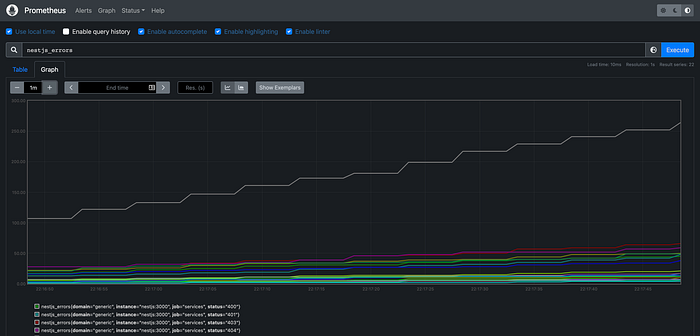
Awesome! Now we have some metrics to work with. Let’s make a proper chart for them.
Step 8. Visualising metrics
Remember our first part requirement? One of the goals was to be able to categorise our errors. Also we would definitely like to have errors per second chart. We’ll use rate prometheus function along with grouping our metrics by domain and HTTP status:
sum by (domain, status)(rate(nestjs_errors[30s])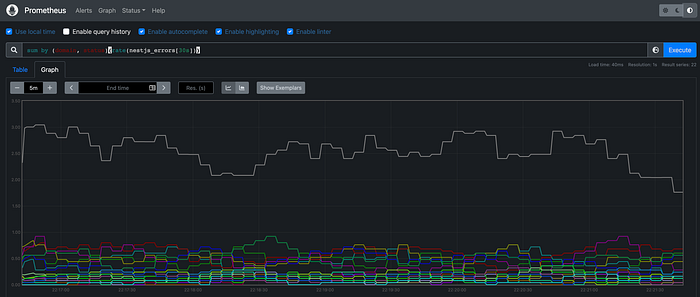
That’s it! We achieved our goal. We have structured, unified, enriched errors that could be referenced (e.g. by user) by id, searched through the logs easily. Moreover, all the code could be extracted to a separate library and be shared within your company.
Summary
In this article, I described in details how we can collect NestJS errors, export them as metrics to monitoring system (Prometheus in our case). In the next article, I will describe how to visualise these metrics in Grafana.
Find the full source code on Github.
Also, you might like my other stories: